When dealing with uncertain situations, probabilities can help make decisions. You can use the expected value to find the best option.
The expected value tells you the average of all the outcomes, weighted by the probability.
So, for example, if you can buy a lottery ticket for $1 and it has a 0.1% chance of paying out $100
then the expected value is $-0.899.
Since you have a 99.9% chance of losing your dollar, buying the lottery ticket
has a negative expected value.
While expected values can help you understand a probability system, they do not capture all the nuances of the probability system. Sometimes it is more important to look at the probability distribution overall to understand how it impacts your decision. Two situations where this applies frequently are game design and finance.
Game design
Suppose you are designing a board game where you want players to roll some dice to get a number roughly between 1-12. Two options you consider are to use a single 12-sided dice or two 6-sided dice together.
With a 12-sided dice, you can get values 1-12 with an expected value of 6.5. With two 6-sided dice, you can get values 2-12 with an expected value of 7. So in terms of usability and expected value, both options are pretty similar. Two 6-sided dice cannot support the outcome of getting a 1 but that can be usually worked around in your game design by eliminating or shifting outcomes.
The far more important difference is the distribution of outcomes!
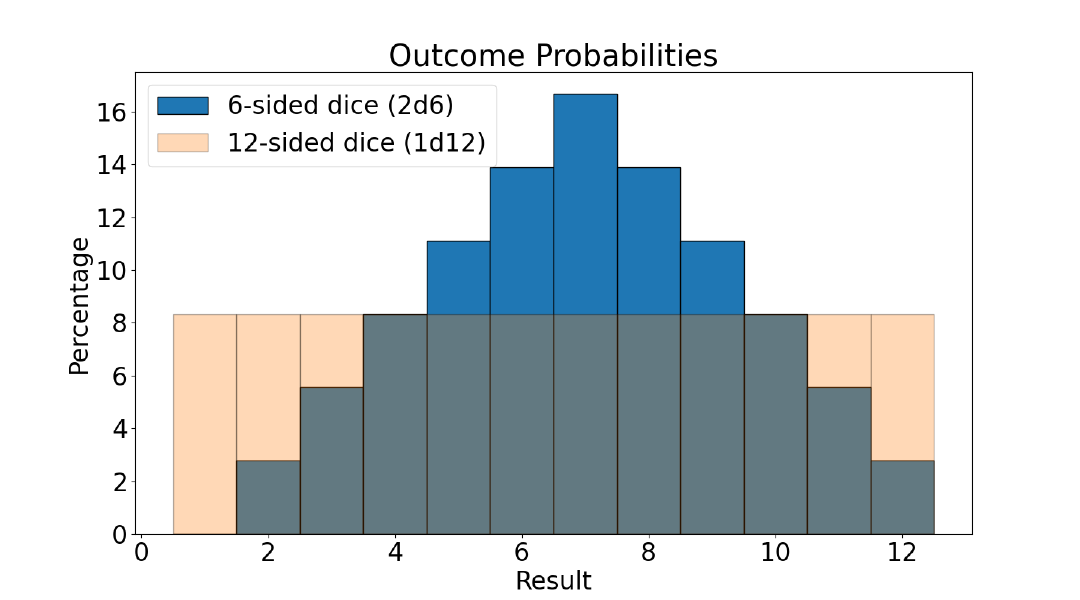
The graph above depicts the probabilities of outcomes. With a 12-sided dice, all values are equally likely. However, with two 6-sided dice, you get a wider range in the probabilities. So, as a game designer, you have to decide how this distribution impacts the game experience. The equal possibility of all outcomes with a d12 can seem thrilling or can seem monotone.

Settlers of Catan uses two 6-sided dice as its core mechanic. In the game, each resource is associated with a number between 2-12 and you roll the dice to get the resources associated with that number. This introduces a lot more variability in the game as some important resources become limited (as they are associated with unlikely dice rolls) and others become overabundant. This can vary across games and requires players to employ different strategies in different playthroughs.
D&D on the other hand uses both styles. Its core mechanic is to use a single 20-sided dice which gives an “anything is possible” feel. However, for its secondary mechanics like damage and rests you will often combine rolls of smaller dice. Using the smaller dice allows the players to avoid extreme values and provide a little more stability to the game experience.
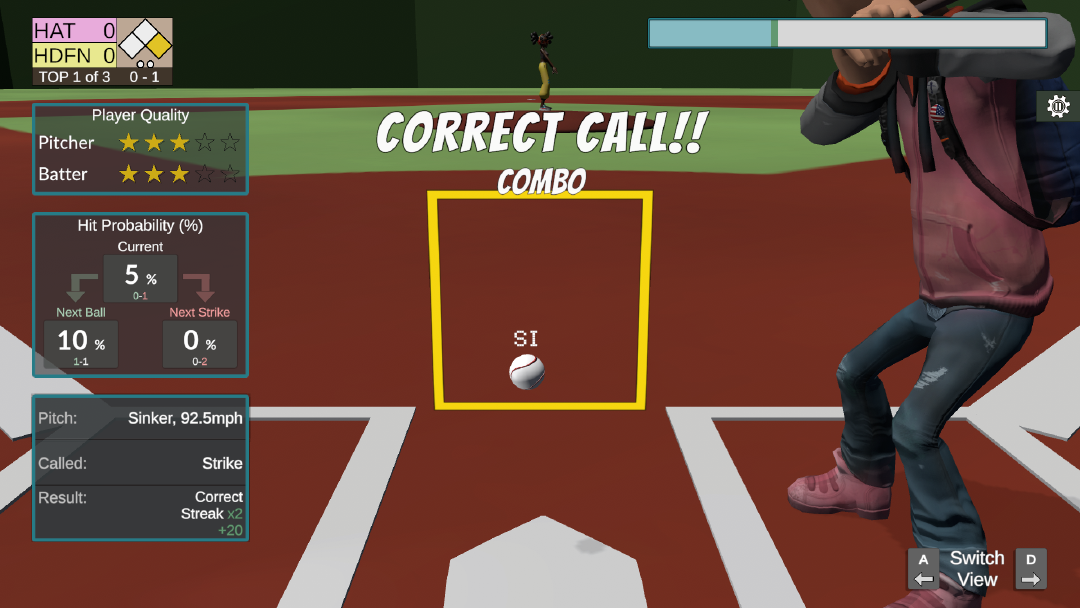
I discovered a similar problem when developing The Ump Show game where you play as a baseball umpire and react to the actions of the pitcher and batter characters. The characters choose their action based on some probabilities. While picking the probabilities, I made sure that I was happy with the expected value of how frequently some actions would happen (like the batter hitting the ball or the pitcher challenging the umpire’s call). The expected frequency was just often enough to provide variety without being annoying/repetitive.
Unfortunately, the game was annoying and repetitive for some people. Some users complained that they saw umpire challenges happen 5 times in a row! I assumed I must have messed up random number generation or my probability comparison logic, but that didn’t turn out to be the issue. The problem was that I only focused on the expected value instead of focusing on the distribution of the frequencies. Effectively, I was picking from a uniform probability distribution and the event occurring very frequently was just as likely as it happening moderately frequently or infrequently. Some players were being overwhelmed with repetition and others were never seeing the mechanic at all!
One benefit of developing a video game over a board game is that I don’t have to come up with rules that are easy to explain. So I chose to implement logic in the game to dynamically adjust the probability of an event based on how recently it had occurred. This allows for everyone to experience the variety of the mechanics in the game roughly at the same frequency.
Finance
Matt Levine often shares this simplified view of modern finance instruments:
- Future cash flow can be turned into a financial instrument that can be sold now
- The financial instrument can be sliced into different packages that match different risk appetites
So for example, if a bank gives you a loan then the bank expects a flow of payments from you. The bank can take that expected cash flow, package it up, and sell it to others. The bank might be more interested in getting some definite-money now in exchange for maybe-money later. Others might have money now and might like to exchange it for more maybe-money later.
To illustrate the point I will make up some numbers.
Suppose the bank has given you a loan and expects to get back
$1000 (including interest) from you. Suppose it expects to get this amount back
with a 99% probability. However, the bank wants money now instead of waiting for
maturity so it can sell this expected cash to someone else. The bank could sell
the rights to $1000 later in exchange for getting something like $980 today. The
person buying the rights is expecting to make $1000 with a 99% probability. This gives
an expected value return of $990 resulting in a profit of $10.
However, the repackaging doesn’t stop here because people don’t just look at the expected value. They look at the distribution. Some people are looking for a lot more risk exposure because they know they will get paid more for it and in aggregate they will average out if they buy enough things. Other people are looking for hyper-safe investments and they are okay with low returns in exchange for avoiding exposure to extreme outcomes.
So the bank could find someone
interested in taking a 99% bet, but they can find a lot more people who are interested
in taking a 90% bet for more returns and people who are willing to take a 99.9% bet
for smaller returns.
If the cash flow is split into two packages: a senior claim that gets paid off first and a junior claim that gets paid off second then we slice the probability distribution. The senior claim gets the “middle” probability distribution. Their chances look similar to what we saw with rolling two 6-sided dice, the middle outcomes become more likely and the extreme outcomes become less likely. If the original loan-taker goes bankrupt, the senior claim is first in line to get their money. So the chance of the loan going to zero is reduced.
The junior claims, on the other hand, get more exposure to the extremes. If the original loan-taker goes bankrupt, then it is more likely that the junior claim will not get anything back. If everything goes well though, then the junior claim made more money because they got a better deal for taking on the riskier asset. This is similar to the single 12-sided dice roll where the extremes are more likely.
At a high level, a company’s equity and loans are doing the same thing. A company provides value both to its equity holders and loan holders. However, the equity holders are exposed to a lot more of the extreme outcomes (company going bankrupt or growing dramatically). For the equity holders, the value of their stake can go to 0 or grow unboundedly. For the loan holders though, the outcomes are a lot more limited. Their stake is less likely to disappear as they get the first claims in bankruptcy. Similarly, their stakes can’t grow significantly as they are limited to the pre-agreed interest.
At a low level, financial instruments are constantly being sliced and resliced to produce packages with more exact risk profiles. And these risk profiles are described by the range of the outcomes and their probability distribution, not just by their expected value.
I don’t think they describe their risk profiles in terms of rolling two 6-sided dice versus rolling one 12-sided dice. I think it would be more fun if they did!